3 Evaluation of 3 consumer BCIs
This chapter addresses G1 (Section 1.2) by evaluating 3 of the consumer BCIs presented in the Background Chapter 2: EPOC (Section 2.2.1), MindWave (Section 2.2.2) and TrueSense Kit (Section 2.2.3). The BCIs are evaluated based on their feasibility for alpha feedback training and finally in the conclusion of this chapter we will select a BCI to use in the further development of AlphaTrainer. This conclusion will be based on several aspects such as comfort and connectivity. However, the main effort of this chapter is put into answering the least accessible - and arguably the most important - factor: "are the BCIs able to measure alpha waves"?
In designing an experiment to answer this, we did a pre-study which is explained in the next section. After that we move on to explain the setup, execution and data analysis of the actual experiment.
Method
To answer whether a BCI can measure alpha, we exploit the property of alpha activity, that it is generally higher when eyes are closed compared to when eyes are open [9]. By comparing alpha levels recorded under a closed-eyes condition to alpha levels recorded under an open-eyes condition, we get a measure of how able a BCI is to detect alpha activity.
3.1 Pre-study
The first BCI we got our hands on was the MindWave. Eager to find out whether it could measure alpha levels, we implemented a simple proof-of-concept prototype (explained in more detail in Chapter 4) able to store SDK alpha values (high and low alpha bands) as well as the raw EEG signal. To get an initial idea whether the headset could measure alpha, we used this prototype to record and compare SDK alpha values under closed and open-eyes condition. Concretely, we performed some recordings in which a test subject would have open eyes the first half and closed eyes the last half of the recording. Figure 3.1 shows two plots of SDK values recorded in this way - the plot on the right has a y-axis limit while the plot on the left shows the actual values.
(a) No y-axis zoom.
(b) With y-axis zoom (0 - 30,000).
Figure 3.1: Two plots of the same MindWave SDK alpha powers with/without zoom.
The plot is representative for many similar recordings we performed and show some giant outliers in the SDK values. Similar outliers were present in the other power bands as well. To find out whether the outliers originated from the raw data or the SDK data processing, we applied offline frequency analysis to the raw data in Octave 2 - an open-source equivalent to MATLAB. We were not able to reproduce the outliers which means they were not present in the raw data. We initiated a correspondence with NeuroSky technicians (see Appendix MindWave forum posts) but they were unable to pinpoint the origin of the outliers in spite of receiving both SDK values and the originating raw data. They were also unable to disclose how the SDK values are calculated due to the closed source nature of their SDK.
In the process of investigating the origin of the outliers, we also suspected EMG and EOG noise. This led us to compare recordings in which we induced such noise to recordings where we minimized it as much as possible by relaxing facial muscles and avoiding eye movement. While this did not prevent the outliers, it showed a significant impact of the noise in the form of a general increase in band power across all frequency bands. This led us to the insight that we would need to minimize facial muscles and eye movement in the actual experiment as much as possible.
From this point, we cleaned the MindWave SDK data by replacing the outliers with the mean value of the non-outliers. We carried on the recordings to compare the alpha levels when eyes are open to when they are closed. A representative plot of the resulting data can be seen in Figure 3.2. In this case we recorded for 4 minutes and summed the alpha levels in bins of 2 seconds. As exemplified in the plot, we measured a clear tendency of an increase in alpha when the test subject closed the eyes at the midpoint of the recording.
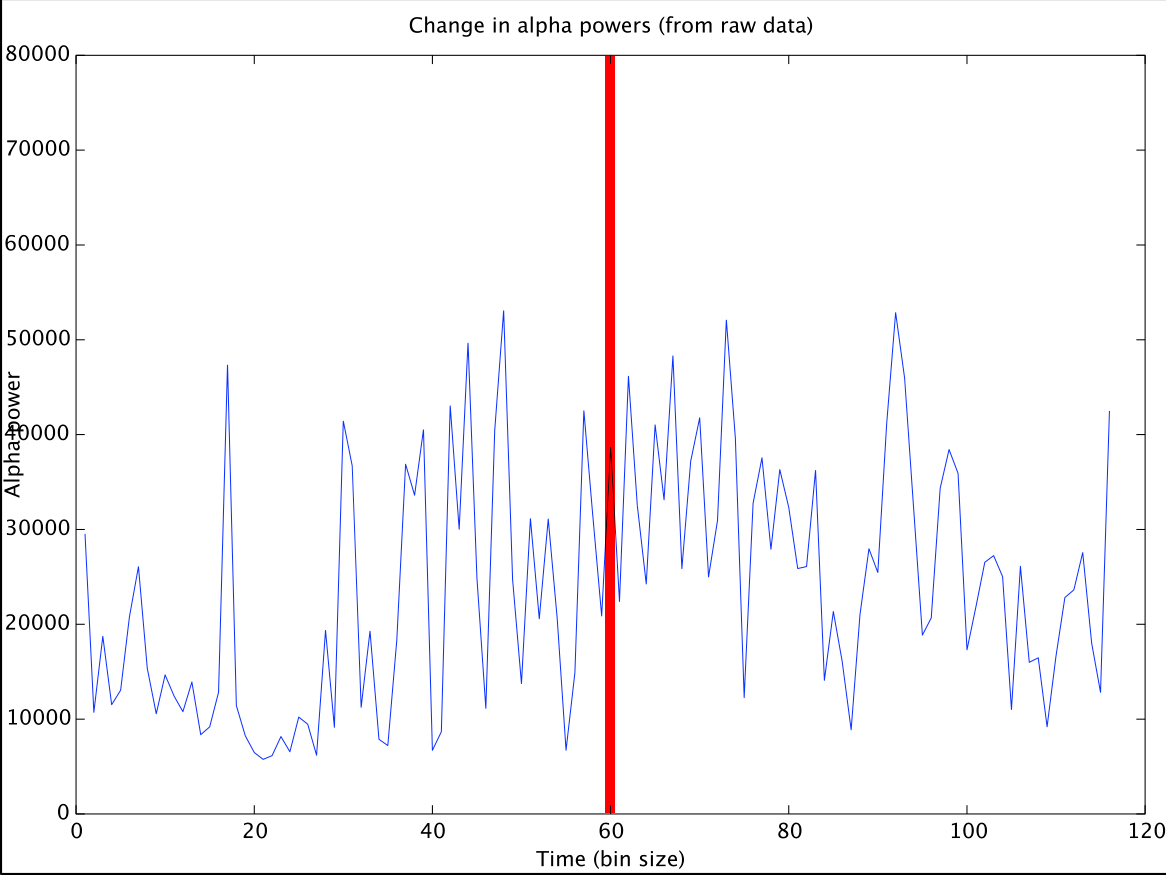
(a) Alpha powers (from raw data).
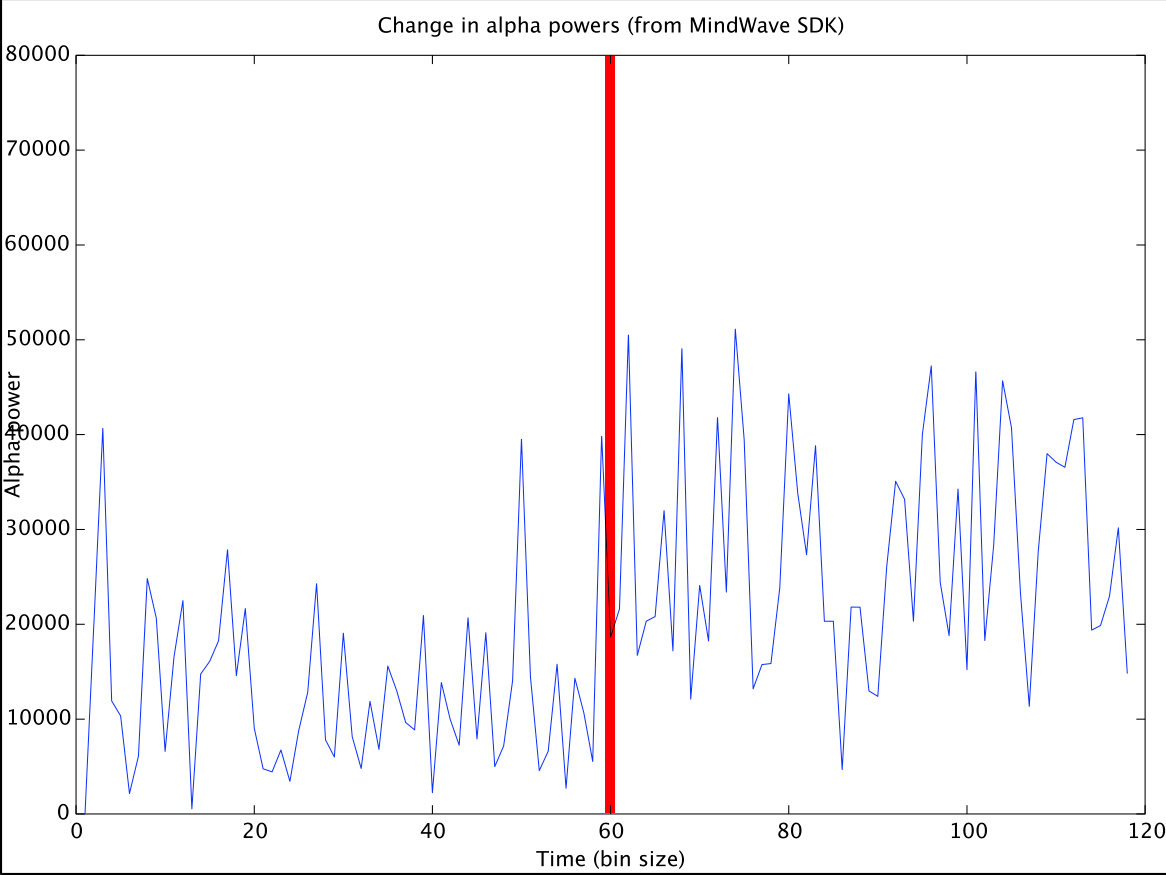
(b) Alpha powers (from MindWave SDK, outliers removed).
Figure 3.2: Alpha levels recorded with open eyes (first half) and closed eyes (second half).
To avoid dependencies on black box SDK calculations and to get comparable results across different BCIs, we chose to rely only on our own signal processing from this point. Both the TrueSense Kit and the EPOC (research edition) BCIs support raw EEG out of the box through their bundled software OPI Console and TestBench (Appendix TrueSense Kit console and Appendix Emotiv EPOC TestBench).
Next step was to select which of the 16 electrode(s) to use from the EPOC headset. We chose to use one of the electrodes placed at location O1 or O2 (back of the head) - the electrodes used in the Smartphone Brain Scanner alpha feedback training application [59]. This placement has the advantage of little EOG and EMG noise (which we tested by comparing recordings from different electrodes while introducing eye movement and facial muscle activation). We did not experience significant difference between the two channels and we decided to use only the O1 electrode in order to make sure results could be directly compared to the results of the other single channel BCIs.
Furthermore we had to decide the placement of the TrueSense Kit BCI. It features flexible mounting by its small size and elastic band mount, so placement is not obvious. To obtain the advantages of recording from the back of the head, we tried mounting the sensor on top of the neck hair at O1. This gave us very noisy data both in the dry and the gel-pad electrode configuration probably due to low scalp conductivity. The same was the case when trying to place the sensor on the temple. We ended up placing the sensor at the side of the forehead as recommended by TrueSense Kit for measuring alpha 1. Finally, we decided to record the TrueSense Kit over radio (ZigBee) rather than to the memory module attachable to the sensor. The latter would presumably give better recording quality. However, in a neurofeedback context offline recording is not relevant since the data must be fed into the feedback mechanism instantly.
This concludes the pre-study which incrementally has led to all the building blocks necessary for designing an experiment which will answer whether the BCIs of interest can measure alpha.
3.2 Experiment design
This section formalizes the design of our experiment which will answer to which degree the BCIs can measure alpha from guidelines by MacKenzie [42]. Revisiting our method, it is assumed that alpha levels are higher when eyes are closed than when eyes are open. From this assumption, we reach the hypothesis tested in the experiment:
H1
The EEG recorded while eyes are closed contains higher alpha levels than EEG recorded while eyes are open.
The independent variables (factors) of the experiment are the eye states: (i) open; and (ii) closed. The dependent variable is simply the alpha level. The task of the participants is to relax as much as possible (keep blink, face muscles and eye-movement at a minimum). We did a pilot experiment on our selves and on a domain expert within experimental psychology to catch potential problems which led to a slight refining of the execution procedure. We later carried out the experiment on 6 participants (4 males and 2 females).
To ensure that we would not only measure a precedence effect or some other learning effect - i.e. gaining familiarity with wearing a brain interface and thus being increasingly comfortable and relaxed (which minimizes EMG and EOG noise) - we varied the BCI recording order as lined out in Table 3.3. We now describe in more detail the execution of the experiment.
| Participant | Headset 1 | Headset 2 | Headset 3 |
|---|---|---|---|
| 1 | EPOC (o/c) | MindWave (c/o) | TrueSense Kit (o/c) |
| 2 | MindWave (c/o) | TrueSense Kit (o/c) | EPOC (c/o) |
| 3 | TrueSense Kit (o/c) | EPOC (c/o) | MindWave (o/c) |
| 4 | TrueSense Kit (c/o) | MindWave (o/c) | EPOC (c/o) |
| 5 | EPOC (o/c) | TrueSense Kit (c/o) | MindWave (o/c) |
| 6 | MindWave (c/o) | EPOC (o/c) | TrueSense Kit (c/o) |
Figure 3.3: Experiment order for headsets and participants - o = open and c = closed
3.2.1 Execution
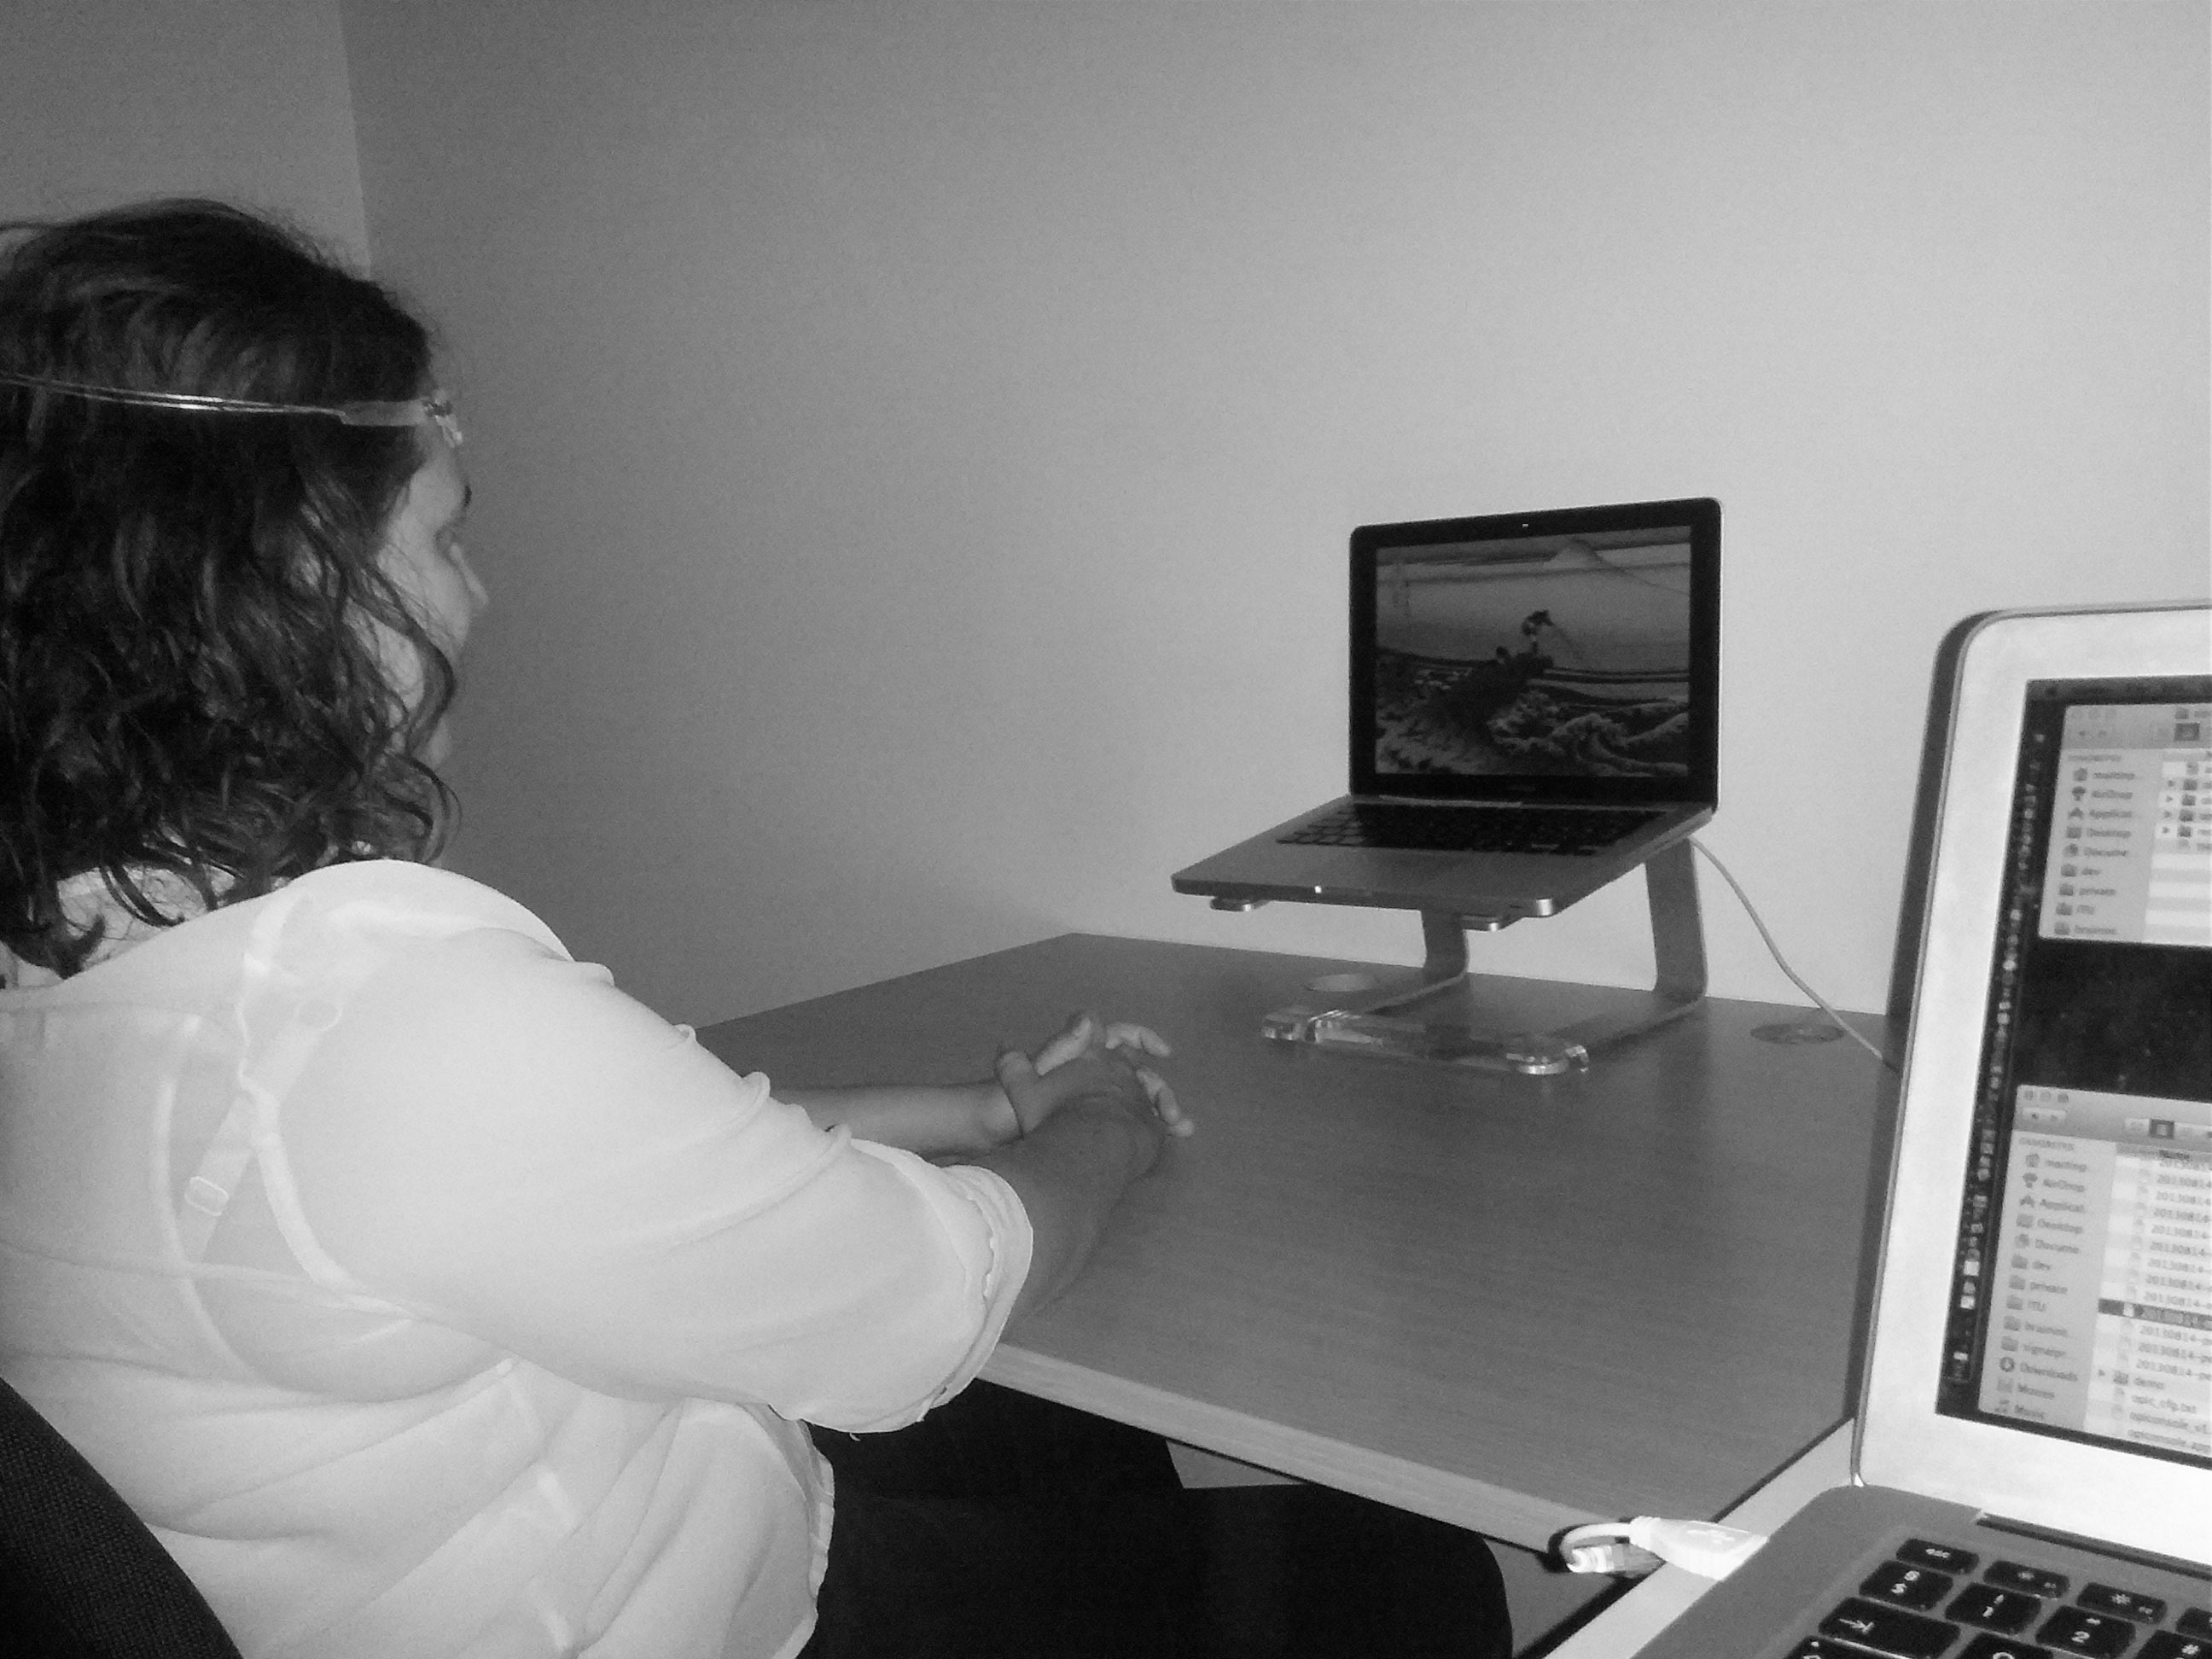
The setting was a dark room with no sun light, a lap top computer with a still image to focus on (Hokusai, "The great wave"), a table and an office chair (Figure 3.4).

(a) Using EPOC.
(b) Using TrueSense Kit.
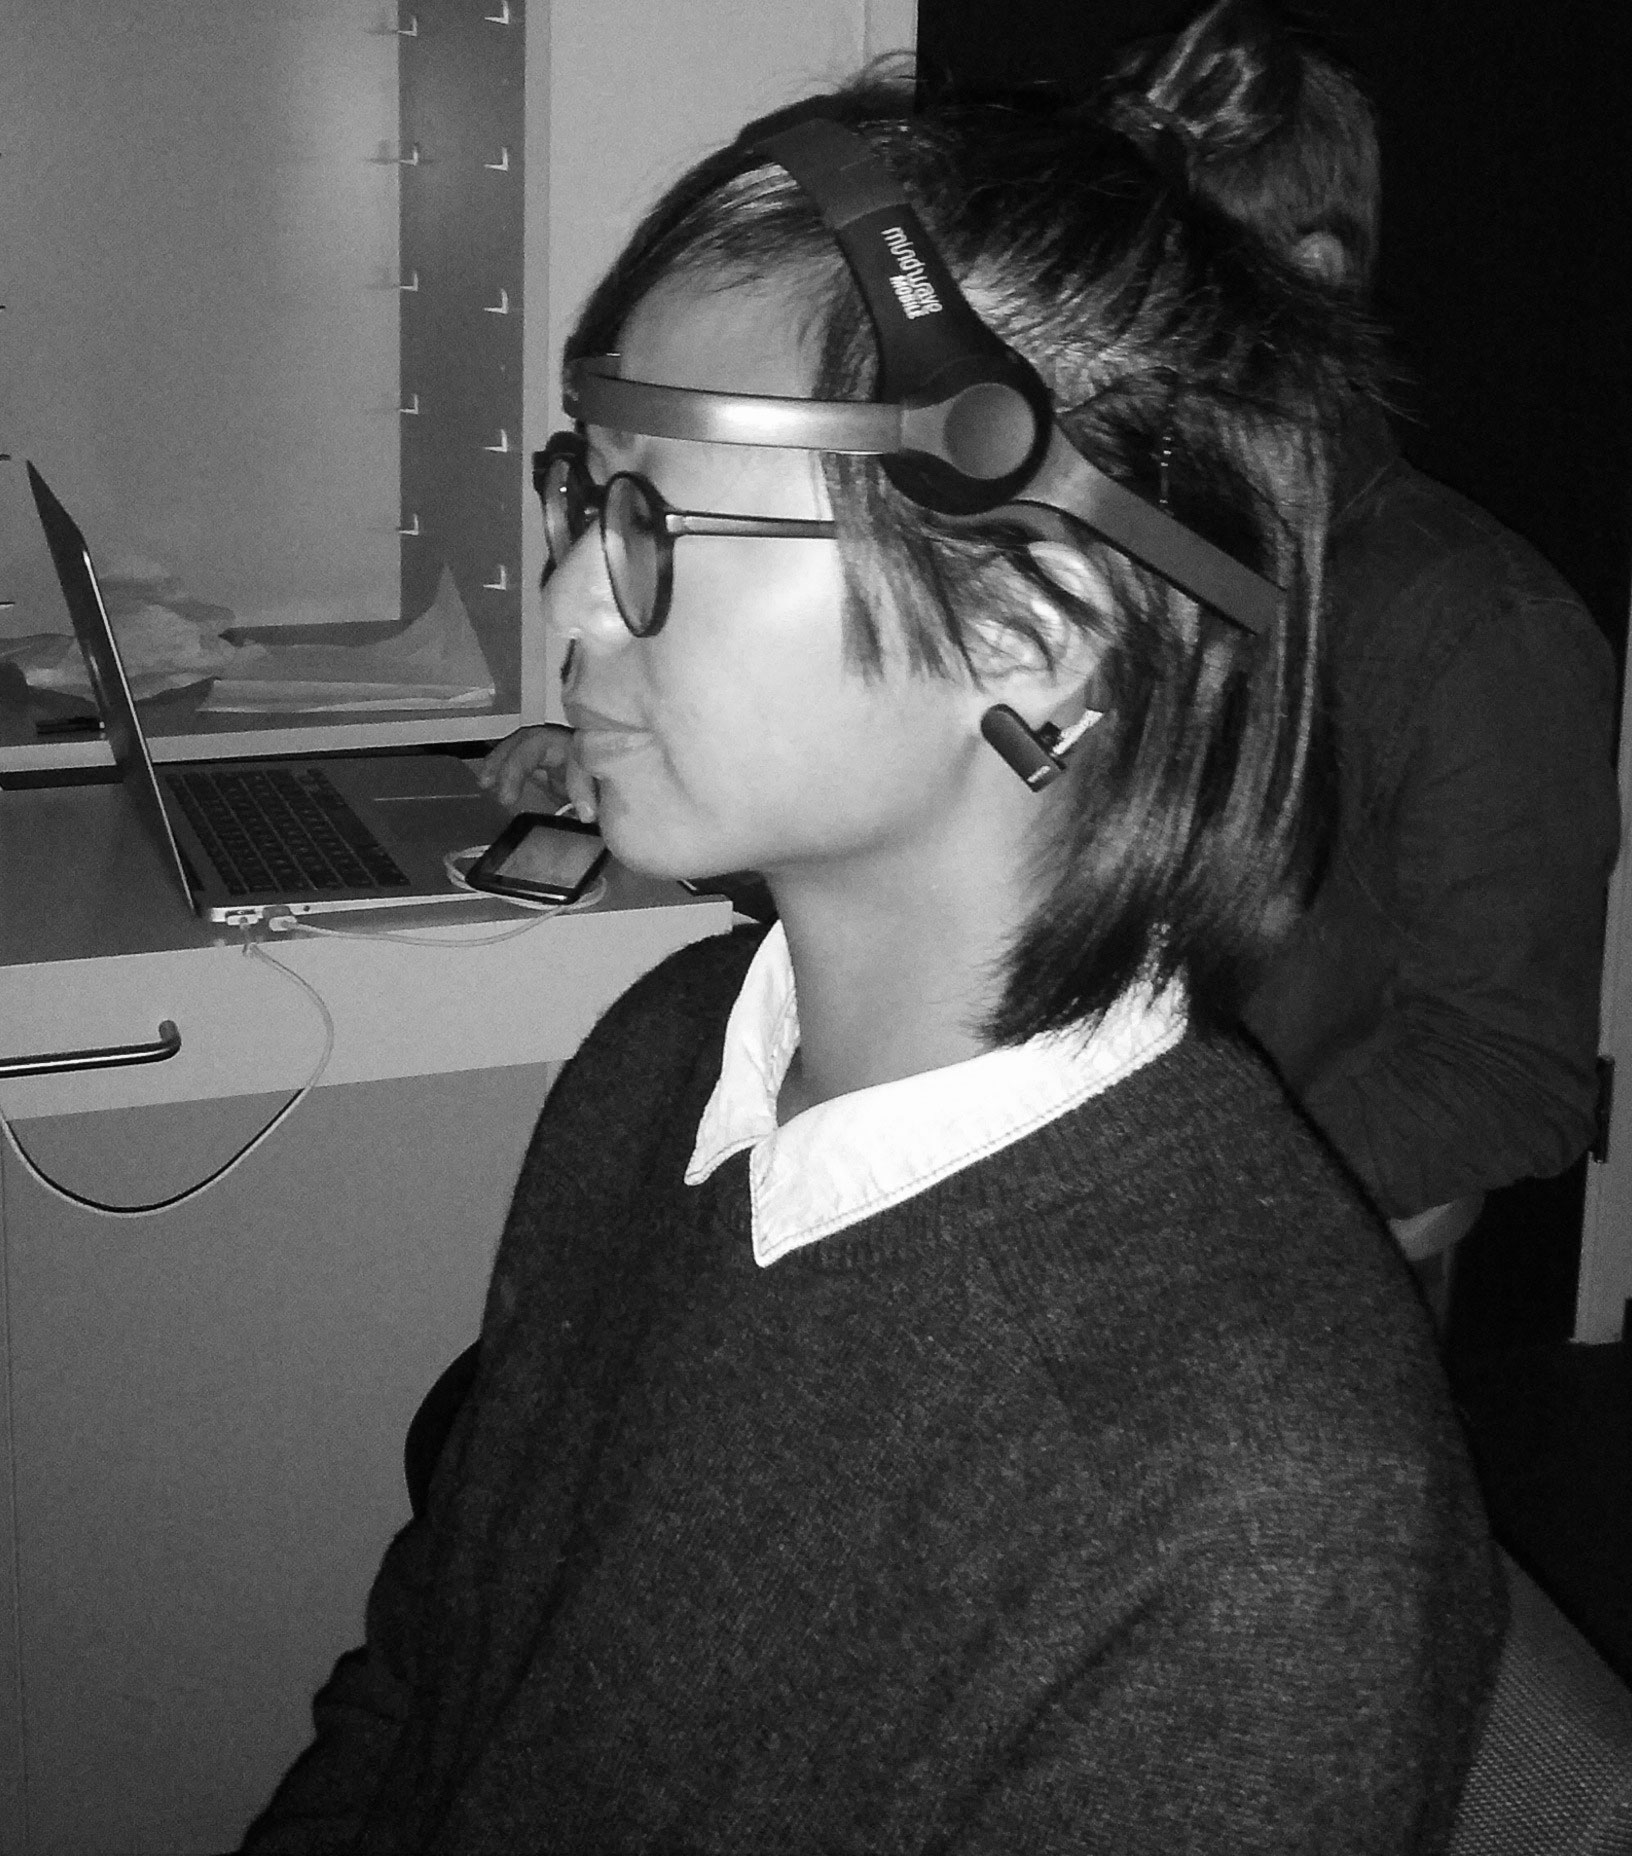
(c) Using MindWave.
Figure 3.4: Experiment setup.
Before entering the recording room, the participant was instructed in a breathing exercise to help her relax. The exercise consisted of breathing slowly through the nose while continuously counting 1 down when exhaling. The count down starts from 4 and whenever 0 is reached it starts over from 4.
The procedure for each participant - BCI combination was this:
- The participant entered the recording room, sat down and got a headset mounted.
- The participant was instructed to sit still, keep eye movement and blinking to a minimum, relax face muscles and to do the simple breathing exercise instructed earlier.
- The participant was instructed to focus at a specific point in the image when having open eyes (to hold visual stimuli constant across all participants and headsets).
- 3 times in a row, we recorded for 5 minutes. After 2.5 minutes the participant is instructed verbally to close or open her eyes.
This procedure was repeated until all 3 BCIs had been recorded. After each session (3 recordings with the same headset) we asked the participant: (i) "how relaxed did you feel during the recordings from 1 to 10, where 10 is very relaxed?"; and (ii) "how comfortable was it to wear the headset from 1 to 10, where 10 is very comfortable?". The results of this questionnaire are listed in Table 3.5. They indicate that TrueSense Kit is the most comfortable BCI to wear and that the EPOC and MindWave BCIs are both "medium" comfortable. The results also indicates that the subjects were quite evenly relaxed across the different BCIs.
| EPOC | MindWave | TrueSense Kit | |
|---|---|---|---|
| Level of relaxation | 7.17 ±1.60 | 8.17 ±1.17 | 8.33 ±0.82 |
| BCI comfort | 5.67 ±2.73 | 5.00 ±1.67 | 8.50 ±2.06 |
Figure 3.5: Experiment micro questionary
3.2.2 Data processing, cleaning and analysis
From the 5 minutes recorded, we extract 2 minutes of open eyes and 2 minutes of closed eyes - thus discarding a 15 second margin on either side of each extraction. These two extractions are subject for the frequency comparison.
For frequency estimation, we use the P.D. Welch algorithm which cuts up the data in small time windows and for each frequency in each window the density of that frequency is calculated/estimated using FFT [68]. These frequency densities are then squared and summed up within a frequency band resulting in a total estimation of the power of that frequency band in the input signal (Appendix Experiment - signal processing).
We compare alpha levels between the open/closed eyes conditions in two ways: (i) Direct comparison by dividing alpha band power under closed-eyes condition with alpha band power under open-eyes condition. This is how the alpha band power is calculated in the Smartphone Brain Scanner alpha feedback training experiment [59]. We call this the "absolute alpha" measure. (ii) We also compare the relative alpha levels of each condition. The relative alpha level is found by dividing the alpha band power with a broad "total" band power (in our case 5 Hz - 25 Hz) to get a measure of how much the total band power is made up of alpha. Dividing the relative alpha level under closed-eyes condition with the relative alpha level under open-eyes condition gives us the "relative alpha" measure. This approach is used in [24] to estimate theta band power.
The absolute alpha measure compares the alpha levels under each condition (open/closed eyes) isolated from the total EEG power level (Equation 1). The relative alpha measure will account for the total EEG power by comparing alpha relative to the total EEG power under each condition (Equation 2). We expect the latter to be the most reliable measure of alpha in that it will be more resistant to EMG/EOG noise (under the assumption that such noise will raise the overall EEG power level somewhat evenly which matches our observations from recordings under induced EMG and EOG).
We did some simple filtering by discarding bins where the alpha or total band power deviates from mean by more than 4 * std.dev. In these cases, the power would mainly origin from EMG/EOG. For each headset, this cleaning excluded 2 of the 18 recordings. The mean values ± standard deviation are listed in Table 3.6. The mean value of the absolute and relative alpha measures inform about the degree to which a higher alpha level has been detected under closed-eyes condition. The standard deviation informs about the consistency of the recording measure and BCI combination (lower std.dev. means more consistent). The resulting data suggests:
- The EPOC and MindWave BCIs can detect alpha (mean is > 1).
- The EPOC headset detect the most alpha.
- The relative alpha measure is the most reliable (i.e. lower std.dev.) as expected.
- The TrueSense Kit sensor only shows a vague difference in alpha between the two conditions which is unlikely to be sufficient for alpha feedback training. Furthermore Figure 3.7f exemplifies the general tendency that the recordings of TrueSense Kit are noisy and lack the expected alpha peak under closed-eyes condition. The narrow peak around 12,5 Hz is likely to be some power grid noise being picked up (which we experienced a lot with the TrueSense Kit). Figure 3.8f also show noisy data from the TrueSense Kit. In this case we see a lot of low frequency noise and its harmonics - the series of peaks appearing approximately every 3 Hz. This noise pattern is roughly the same under open and closed eyes conditions which indicates that the main source of the recording is not EEG (i.e. the alpha peak is missing).
Figure 3.7 and Figure 3.8 show recordings of each BCI for two different participants. They exemplify how the alpha peak varies between individuals. For example, Participant 3 has an alpha peak under closed-eyes condition around 10.5 Hz while participant 5 has one around 11.5 Hz.
| Measure | EPOC | MindWave | TrueSense Kit |
|---|---|---|---|
| Absolute alpha | 4.50 ±3.12 | 2.37 ±1.54 | 0.87 ±0.40 |
| Relative alpha | 2.12 ±0.63 | 1.55 ±0.60 | 1.06 ±0.21 |
Figure 3.6: Mean values of the absolute and relative alpha measures
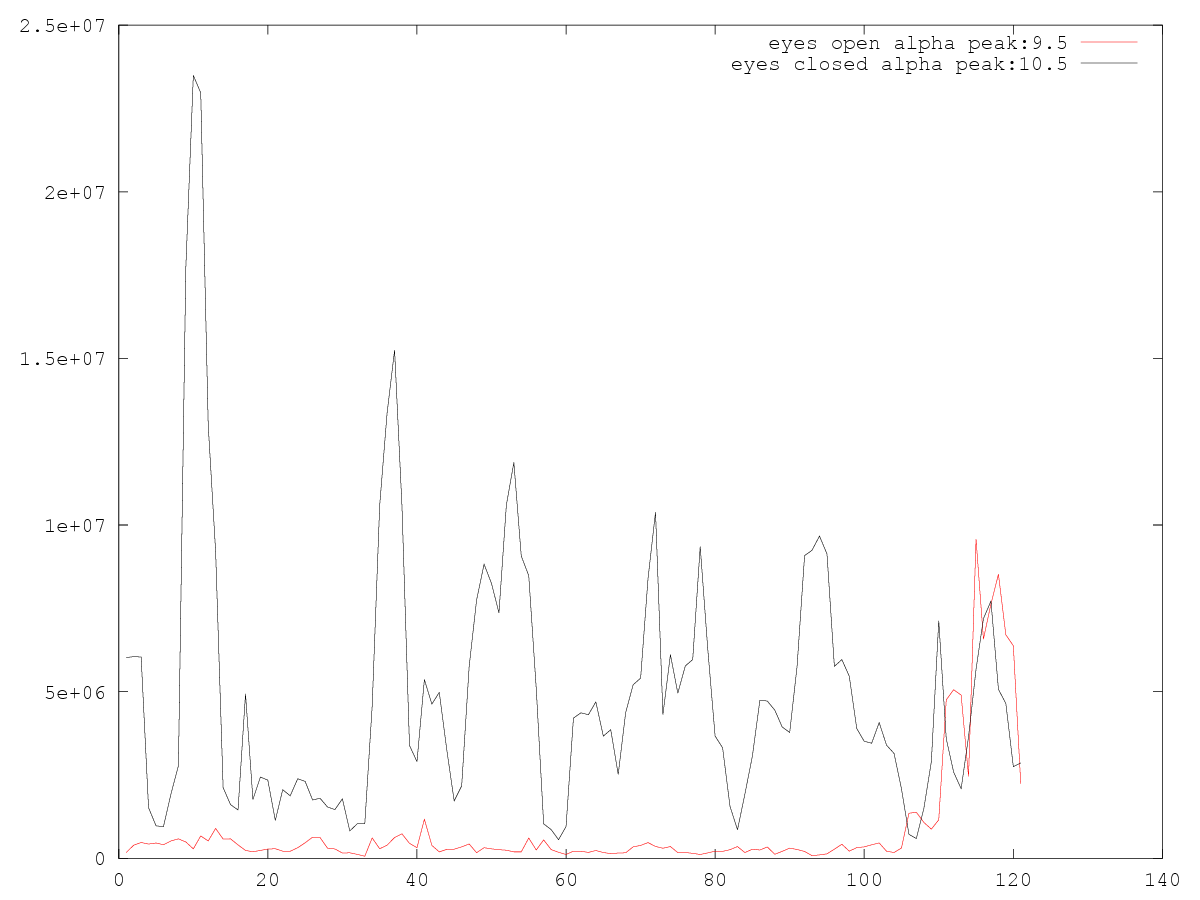
(a) EPOC alpha progress. Alpha peaks: 9,5 Hz (open eyes) and 10,5 Hz (closed eyes).
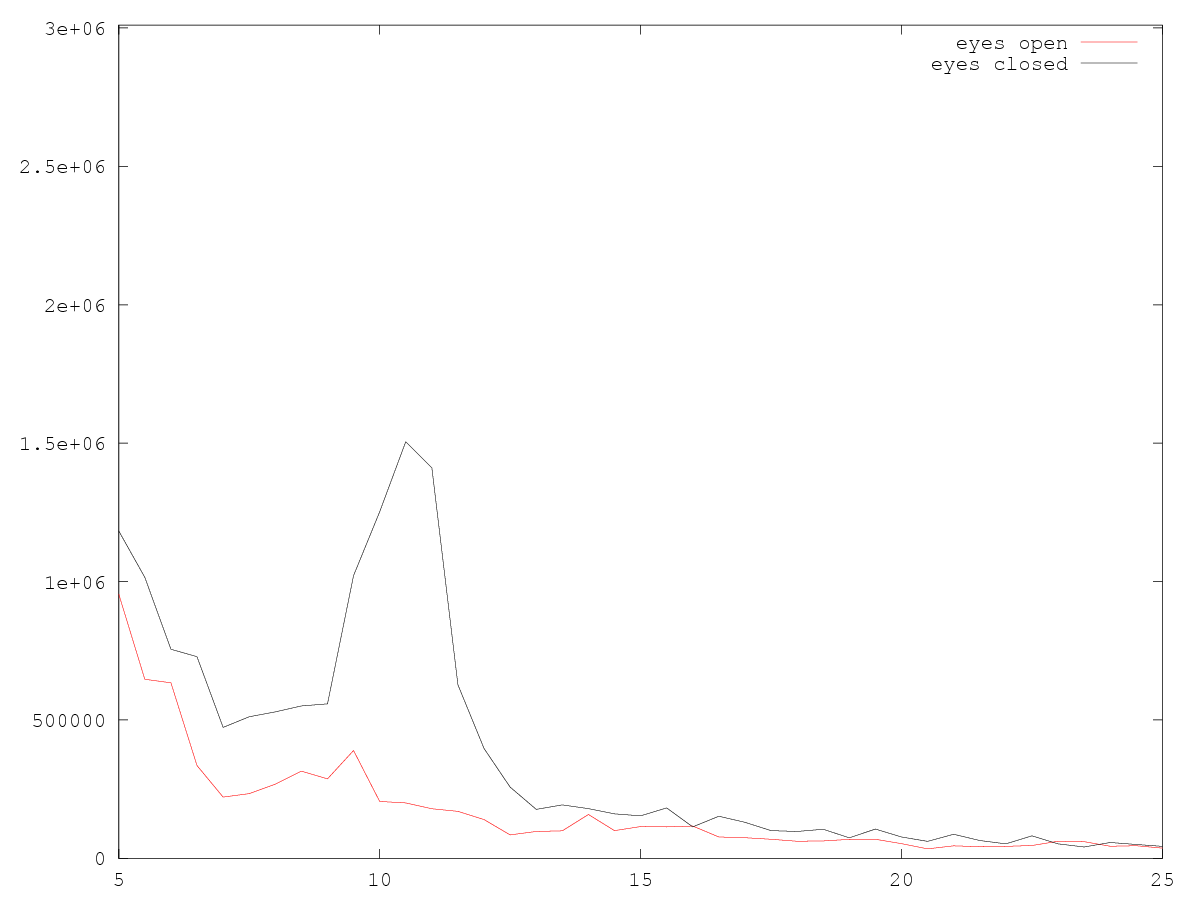
(b) EPOC power of each frequency.
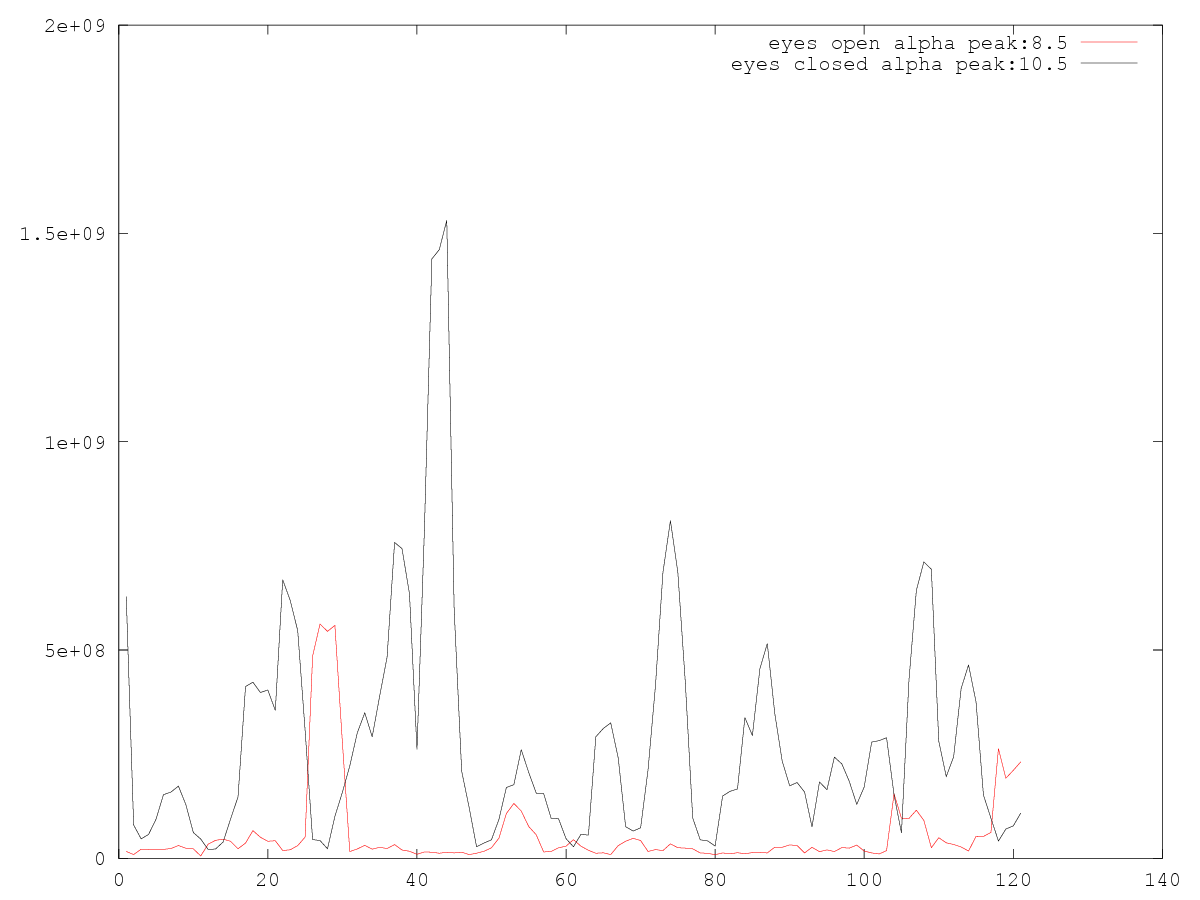
(c) Mindwave alpha progress. Alpha peaks: 8,5 Hz (open eyes) and 10,5 Hz (closed eyes).

(d) Mindwave power of each frequency.
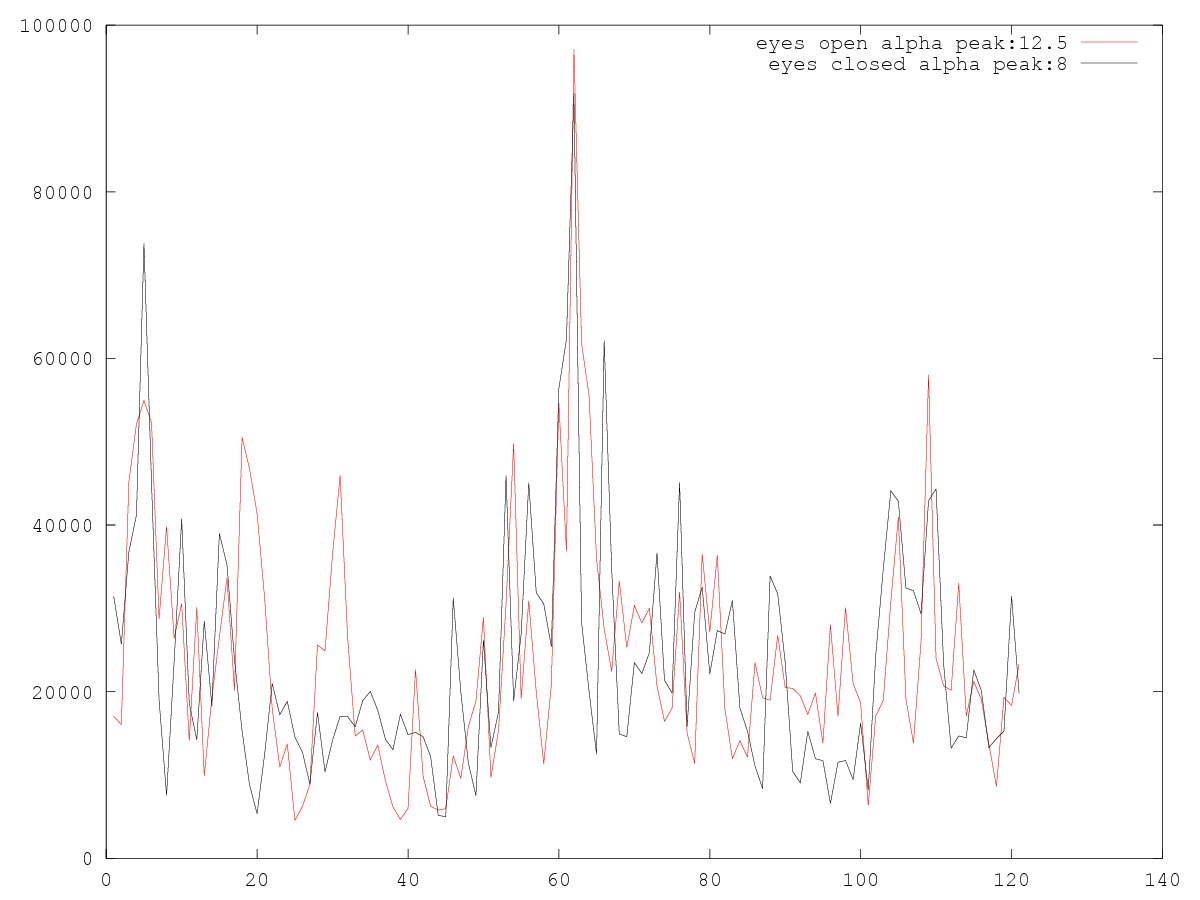
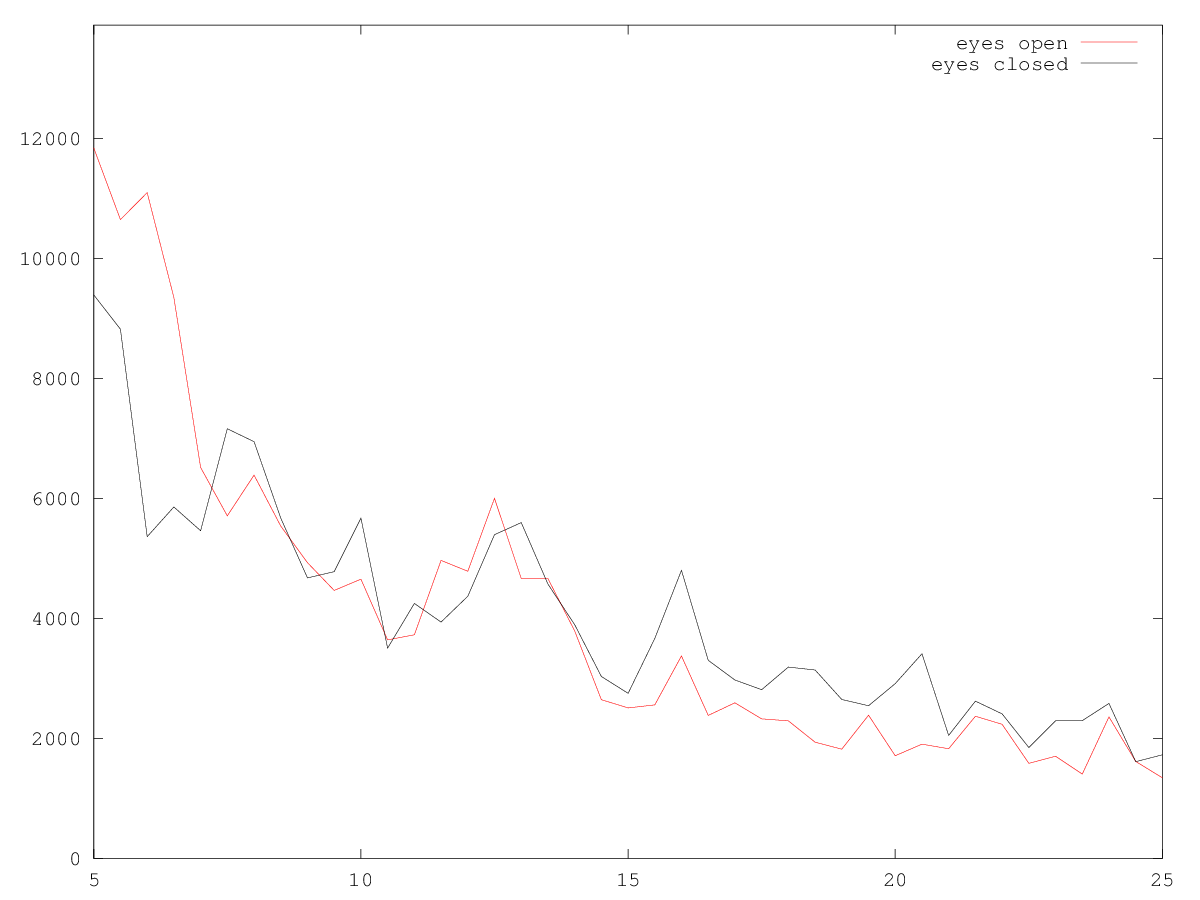
(e) True Sense Kit alpha progress. Alpha peaks: 12,5 Hz (open eyes) and 8 Hz (closed eyes).
(f) True Sense Kit power of each frequency. Pay attention to the narrow (noise) peak around 12,5 with open eyes.
Figure 3.7: Plots from recordings of participant 3 from the experiment. On the left, alpha progress with eyes open (red line) and eyes closed (black line) are plotted. On the right, the power of each frequency is plotted - notice the alpha peak around 10 Hz in the EPOC and MindWave recordings under closed-eyes condition.

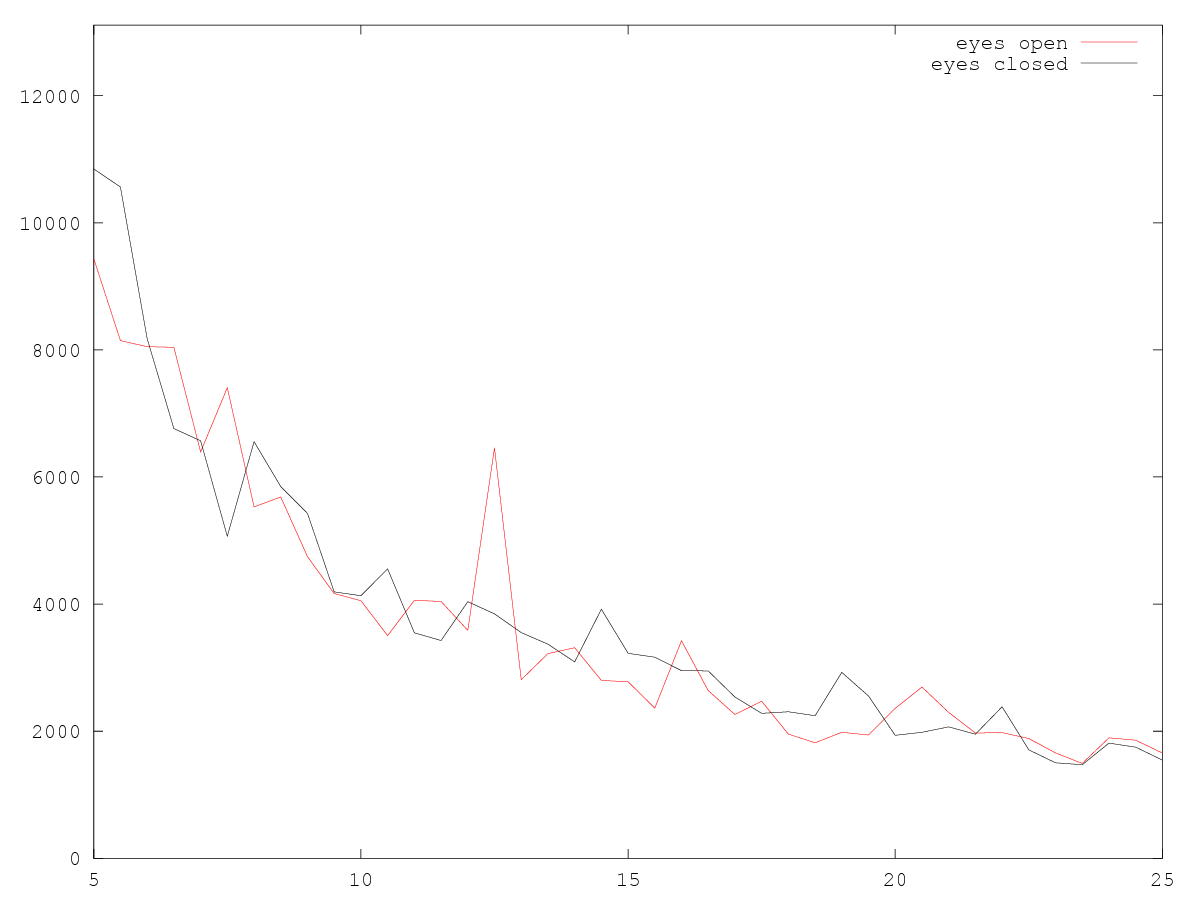
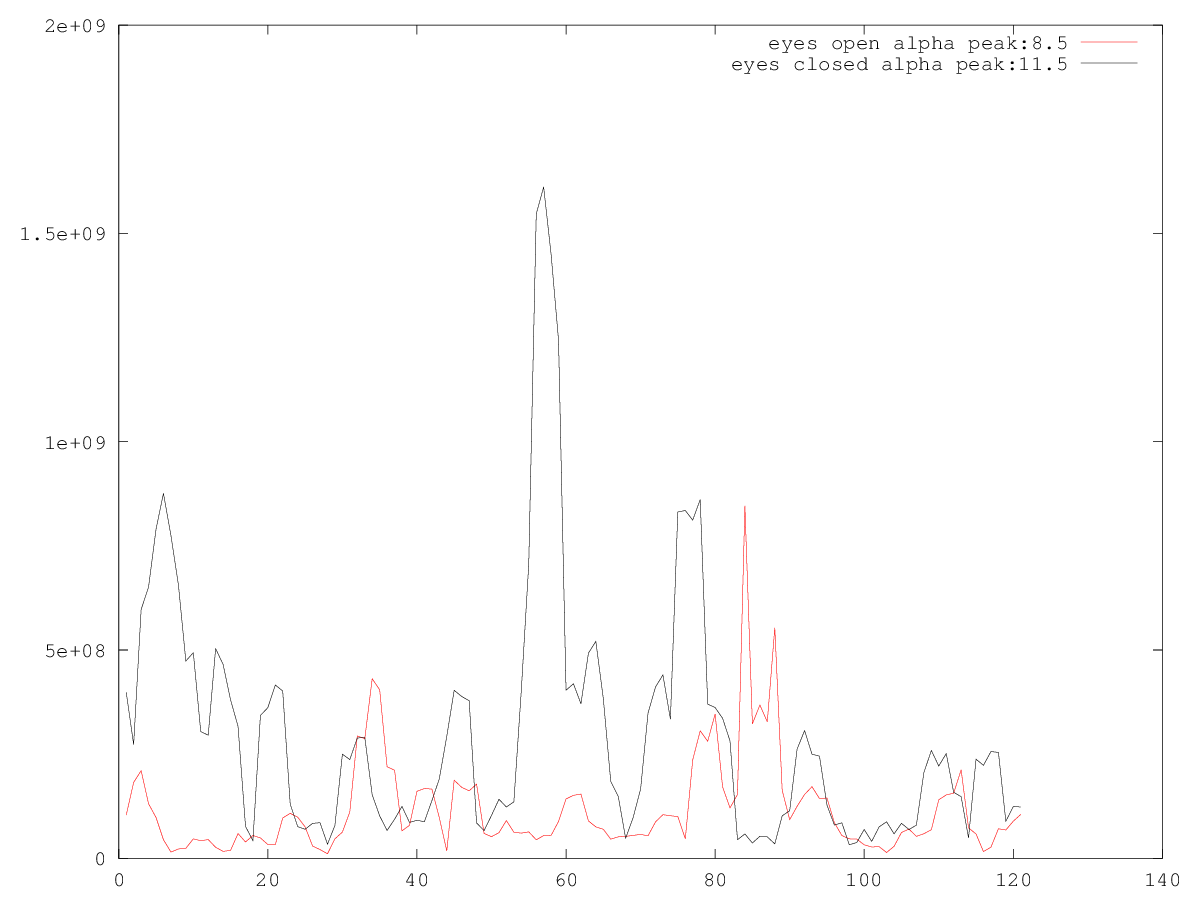
(a) EPOC alpha progress. Alpha peaks: 8,5 Hz (open eyes) and 11,5 Hz (closed eyes).

(b) EPOC power of each frequency.
(c) Mindwave alpha progress. Alpha peaks: 8,5 Hz (open eyes) and 11,5 Hz (closed eyes).
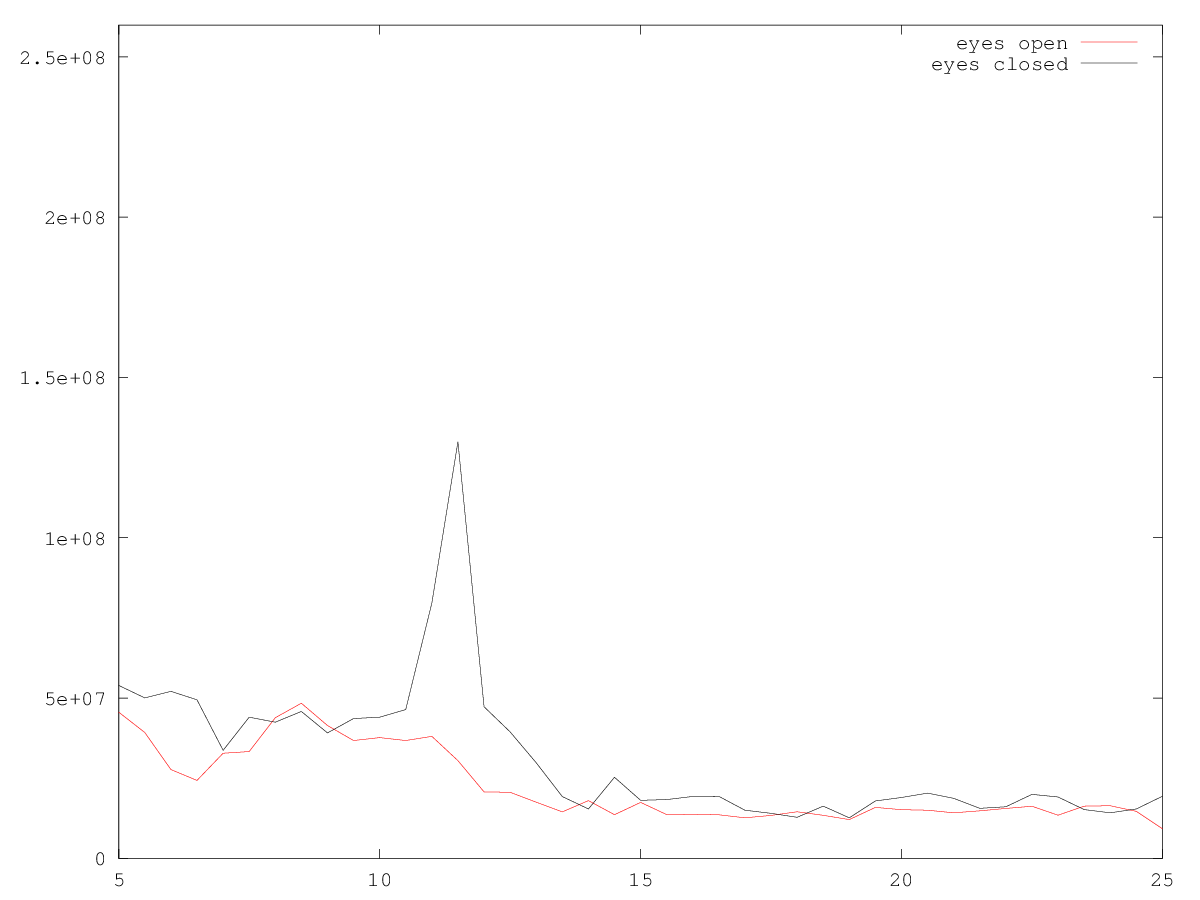
(d) Mindwave power of each frequency.
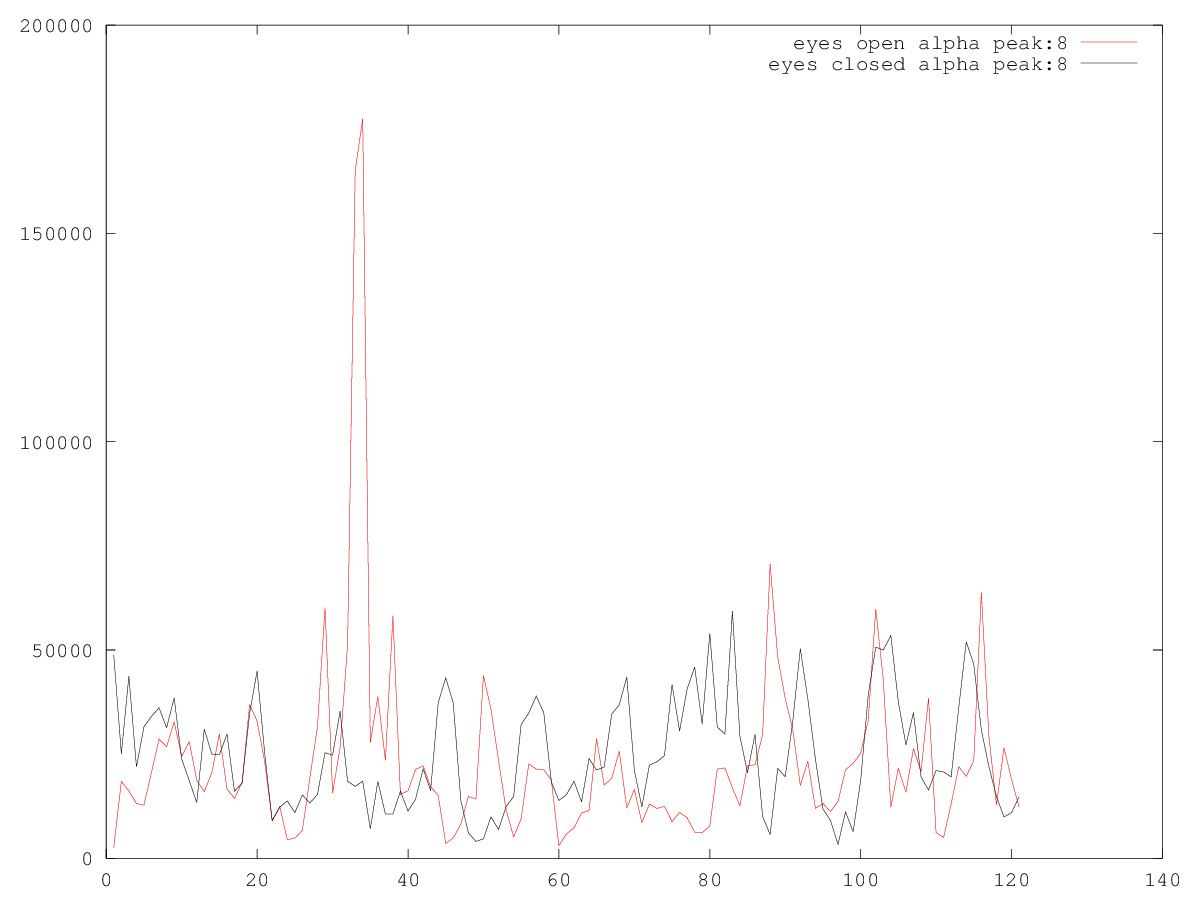
(e) True Sense Kit alpha progress. Alpha peaks: 8 Hz (open eyes) and 8 Hz (closed eyes).
(f) True Sense Kit power of each frequency.
Figure 3.8: Plots from recordings of participant 5. On the left, alpha progress with eyes open (red line) and eyes closed (black line) are plotted. On the right, the power of each frequency is plotted - notice the alpha peak around 11.5 Hz in the EPOC and MindWave recordings under closed-eyes condition.
3.3 Choice of BCI
We have lined up the parameters of the evaluation in Table 3.9. We choose the MindWave BCI in the further development of AlphaTrainer because: (i) it can detect alpha; (ii) it does not require assistance or preparation time to use; (iii) it supports Bluetooth communication; finally (ii-ii) it has out of the box SDK support for mobile devices including access to raw EEG data.
The rationale behind these arguments is based on our overall method which includes building a system deployable for actual use. In a research context (or any context requiring spatial resolution), the EPOC is an excellent choice. And in a quantified-self context in which offline recording and processing is possible, the TrueSense Kit is the obvious choice due to its size and comfort.
Another advantage of the MindWave is that it seems to best represent the future of consumer BCIs. As mentioned in Section 2.2.4, the next generation of consumer BCIs feature Bluetooth connectivity and a dry sensor configuration. By using MindWave in the further development of AlphaTrainer, we are best prepared for adapting to future BCIs.
| EPOC | MindWave | TrueSense Kit | |
|---|---|---|---|
| Outputs raw EEG | (yes) | yes | yes |
| Channels | 14 | 1 | 1 and up |
| Ability to measure alpha (1-10) | 10 | 7 | 0 |
| Preparation time (minutes) | > 10 min | < 1 min | 1-5 min |
| Dry sensors | No | Yes | Yes |
| Comfort to wear (1 - 10) | 5.67 ±2.73 | 5.00 ±1.67 | 8.50 ±2.06 |
| Bluetooth support | no | yes | no |
| Mobile SDKs | (yes) | yes | (yes) |
Figure 3.9: BCI evaluation
Footnotes
| [1] | http://op-innovations.com/en/wearsensor |
| [2] | http://www.gnu.org/software/octave |